01Module
Performance Overview
Live counters, hour-by-hour throughput, output trend across the rolling 10-day window.
Output, quality, pace, channel coverage — every dimension of a distributed scraping team, surfaced in real time. We built it for our own data services team; partners can run on it too.
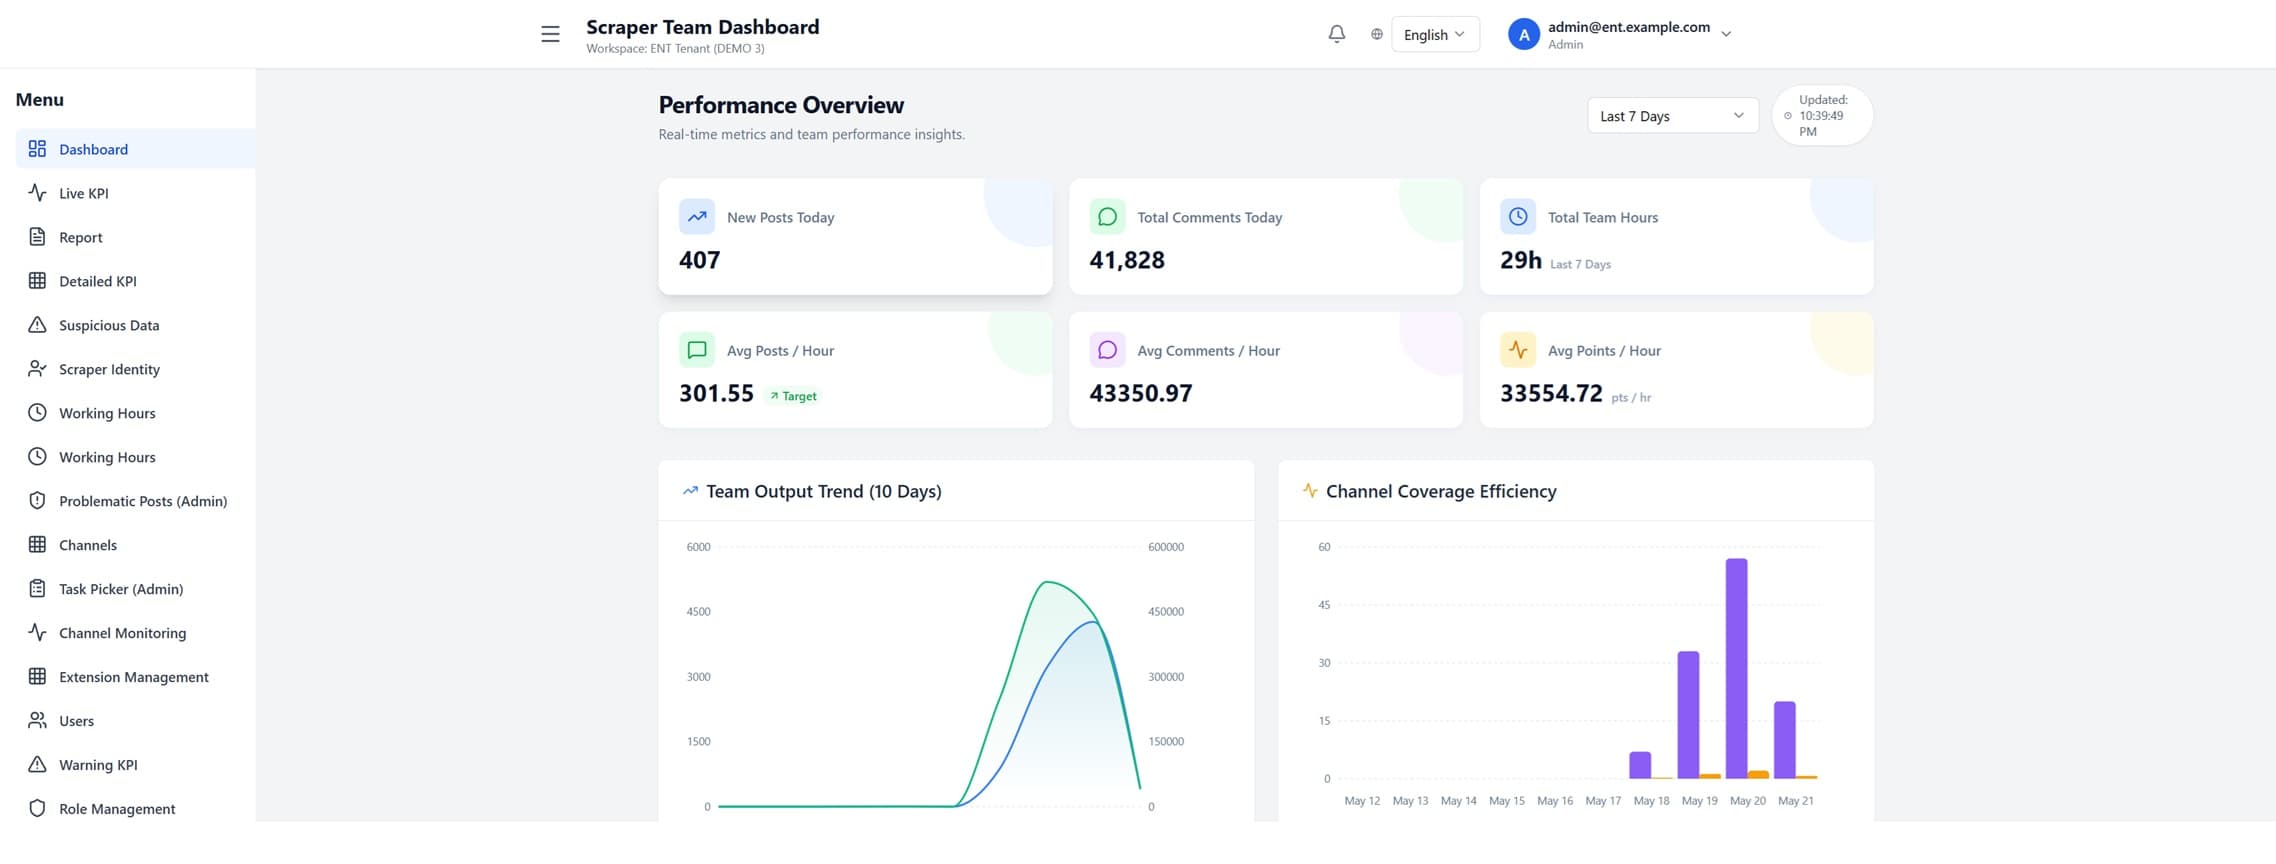
The dashboard is built from the workflow up — every screen reflects a real question the team asks every day.
Live counters, hour-by-hour throughput, output trend across the rolling 10-day window.
Per-scraper output, ranked. Drill into anyone's day and see exactly what they captured.
Per-channel × per-day grid. Spot which channels stopped producing before the weekly report does.
Captures flagged for review — duplicates, malformed records, IDs that don't resolve. Triage queue baked in.
Time tracking honest enough for distributed teams. No keystroke spyware — just the activity that ties to real records.
Crosses output, quality and pace into early-warning thresholds. Surfaces problems while they're still cheap to fix.
Each row is a channel, each column a day. Numbers are posts and comments captured. Empty cells aren't quiet days — they're missed deadlines. The grid is the single screen our team leads check first thing every morning.
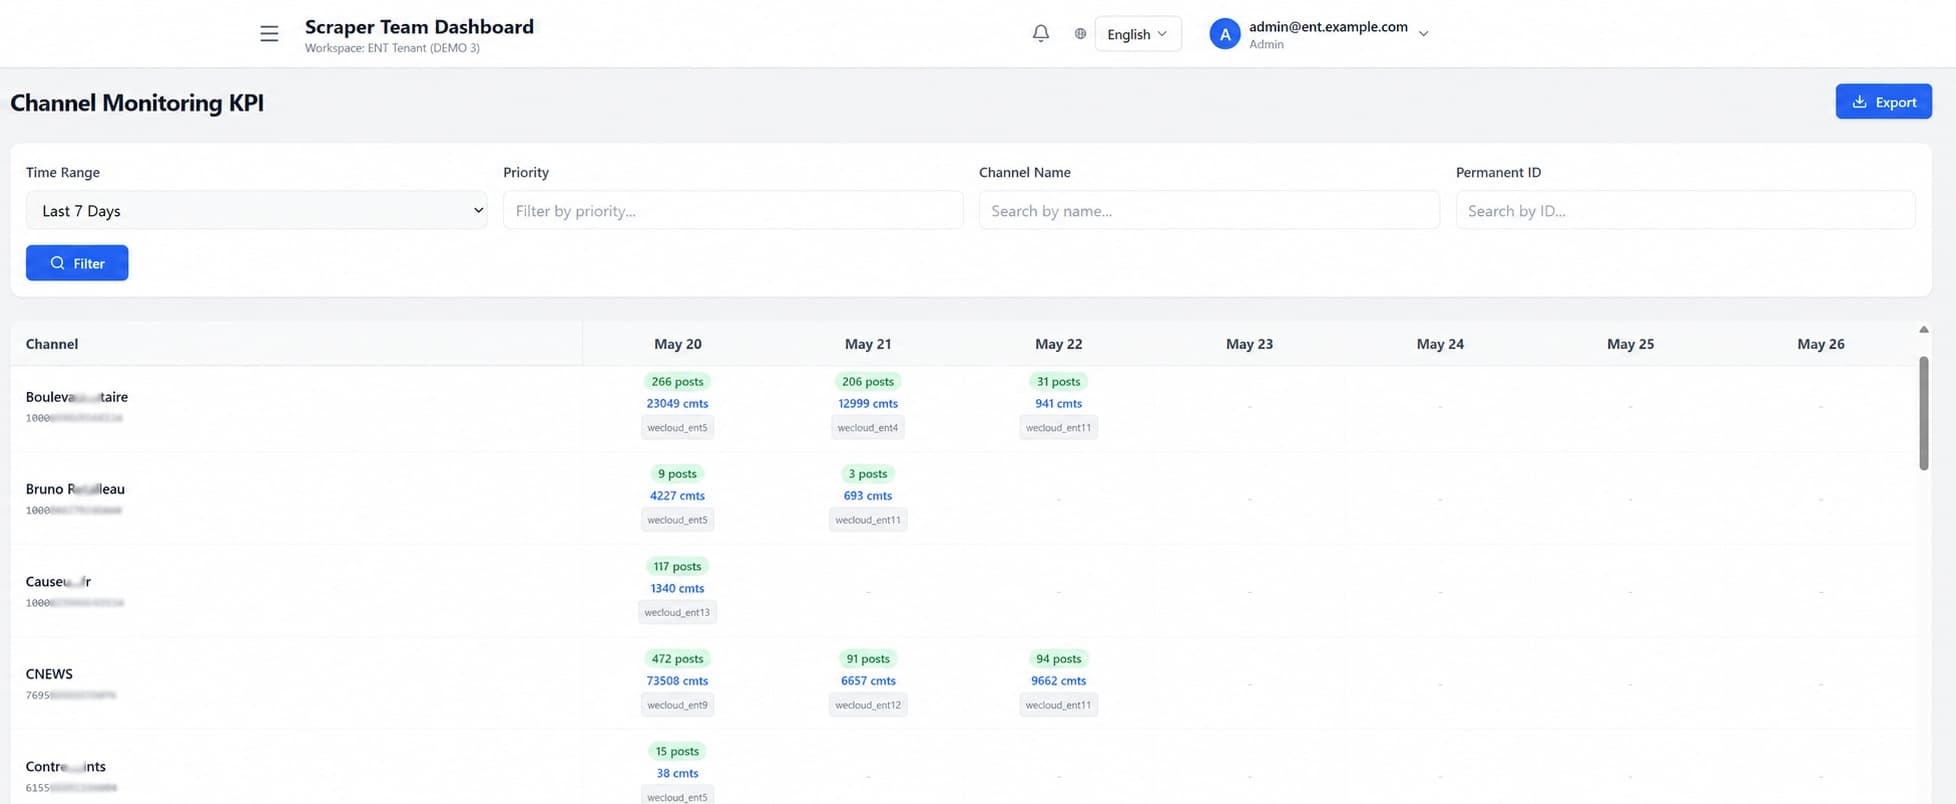
Output and coverage across the whole team. Spot the channels that aren't being touched.
Personal Live KPI tile — output for the day, target vs. actual, working-hours log. Their own scoreboard.
Suspicious Data queue and Problematic Posts panel. Triage in priority order, not by inbox arrival.
Extension management, scraper identity, role management. Onboard a new agent in minutes.
If you operate a distributed data-collection team and your visibility today is a shared spreadsheet, let's talk.